
Hashrate Index Q3-2023 Bitcoin Mining Report: Wakeup Call
Our Q3-2023 Bitcoin mining report is now available.
Q3 has come and gone y'all, and we've got another quarterly Bitcoin mining report to document all of the notable changes and trends that occurred over the last three months.
Our latest report touches on hashprice, the usual network data (hashrate / difficulty / transaction fees), inscriptions, the ASIC market, energy markets, public mining stocks, and more. You can download the report below. Additionally, we also have a longer report with exclusive data available only to Hashrate Index Premium subscribers. If you'd like to unlock the full report, please consult this article to sign up for a Hashrate Index Silver subscription today!
Now, a few highlights from the report.
USD-Hashprice Sees All-Time Low Volatility
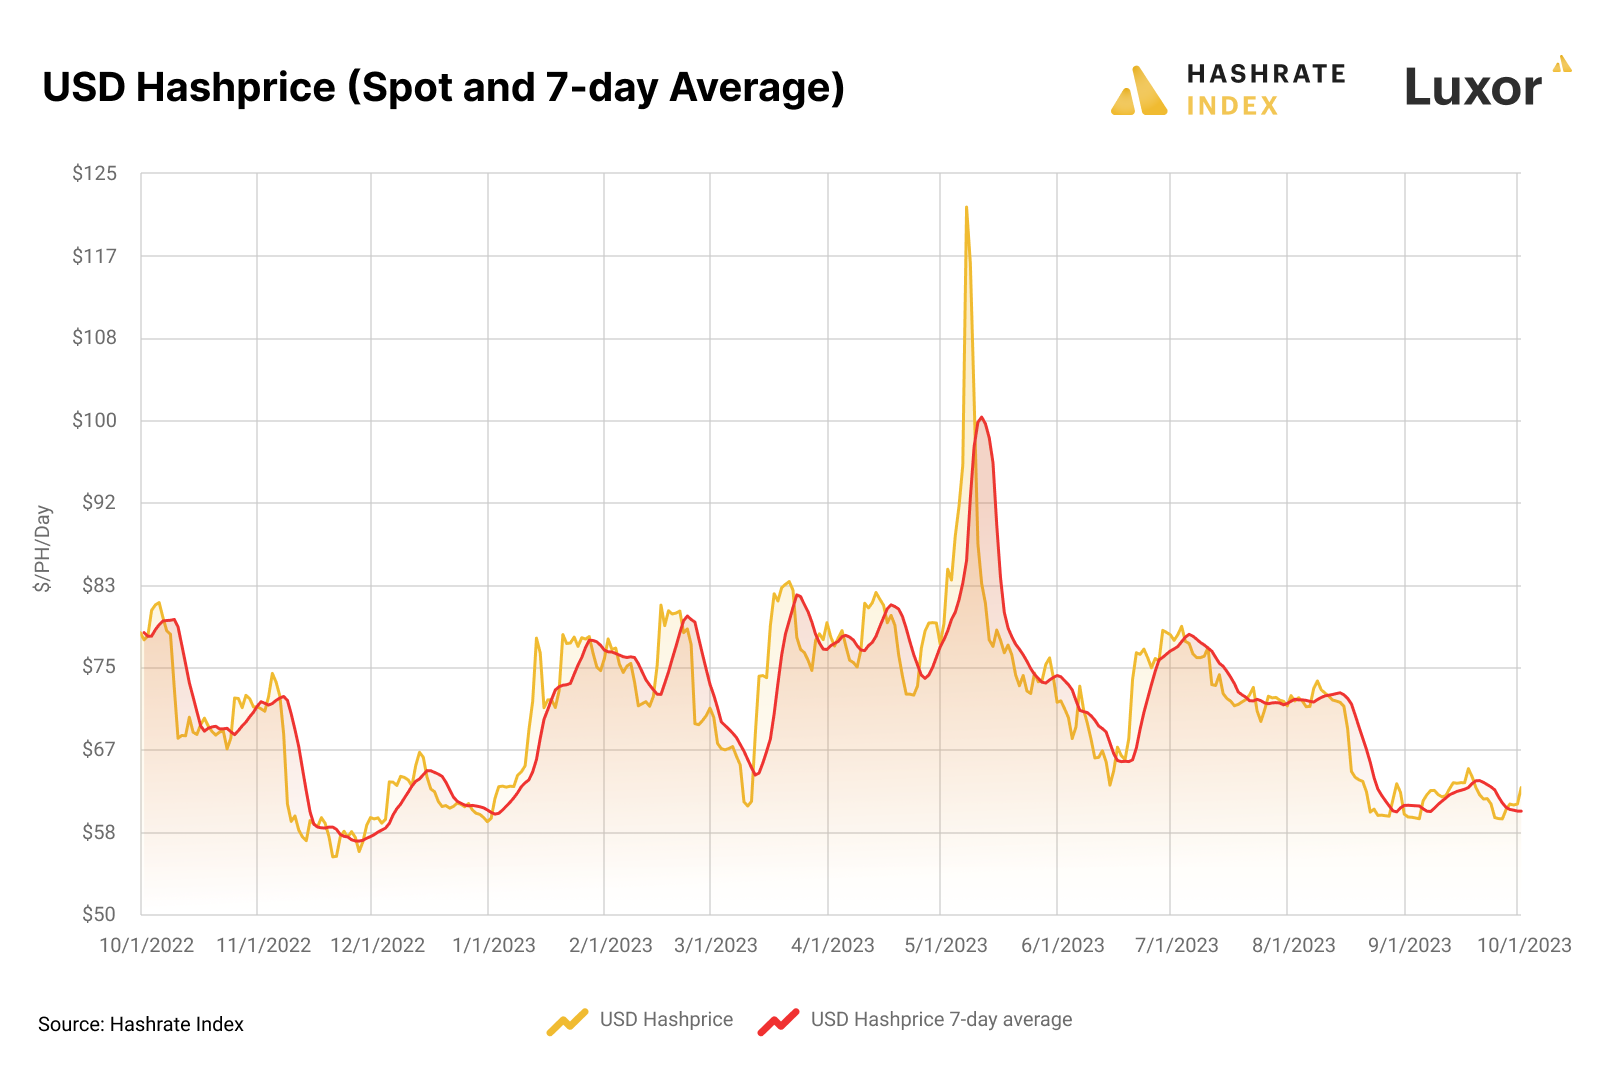
Thankfully for USD-denominated hashprice, Bitcoin’s 2023 price rally continued in Q3, with BTC reaching a yearly high just above $30,000. Bitcoin’s average price in Q3-2023 was $28,100 (vs. $26,350 for the first three quarters of 2023), and this was enough to give USD hashprice some support to keep it from falling as much as it could have given the increase in Bitcoin’s mining difficulty.
Still, even though hashprice was above $70/PH/day for the first half of Q3, it broke below $70/PH/day in August and has been trending toward all-time low territory ever since (in fact, at the time of writing, it’s just below $60/PH/day, creeping ever closer to its all-time low of $55/PH/day). The USD hashprice average for September was $61.71/PH/day, placing it in the unfortunate company of December and November 2022’s averages of $61.94/PH/day and $61.90/PH/day, respectively – a time when Bitcoin’s price was bouncing between $16,000 and $17,000.
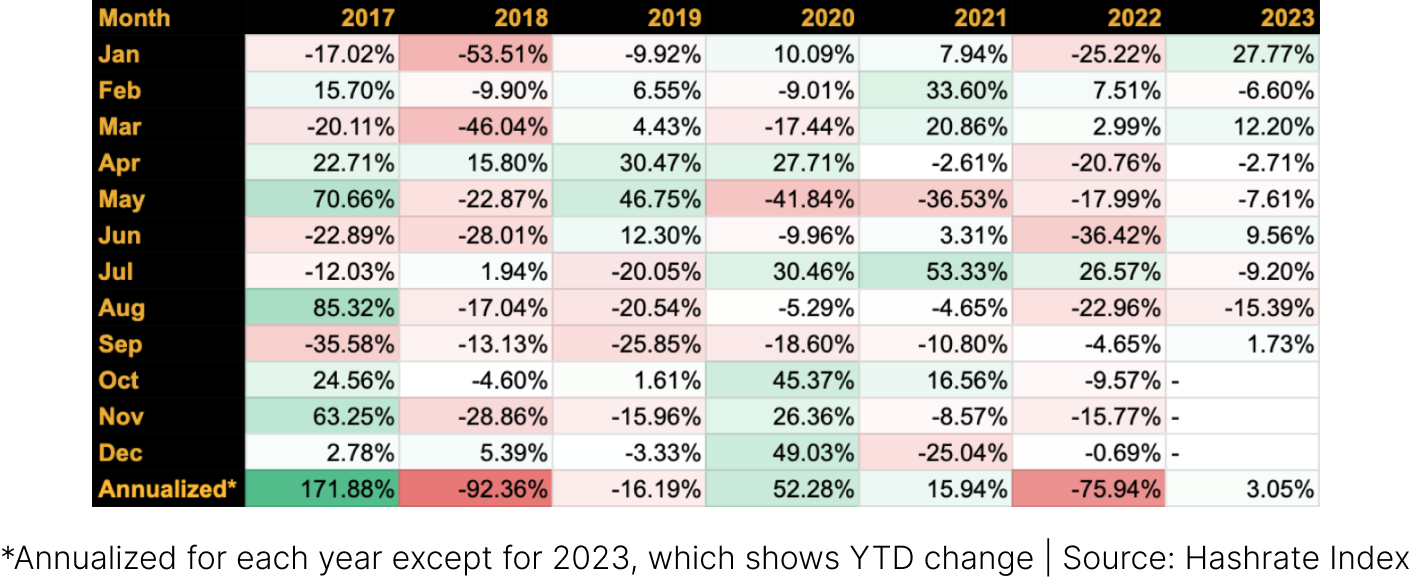
That said, in the grand scheme of things, 2023 (so far at least) has been a more favorable year for hashprice than otherwise. When we compare monthly and annualized returns since 2017, the current year has featured less volatility than any other year in the comparison; Bitcoin’s 63% recovery over the first three quarters of 2023 has been enough to offset Bitcoin’s 7-day average hashrate growth of 59% over the same time frame (in addition to Bitcoin’s price recovery, hashprice has received a little nudge from transaction fees along the way, as well).
Over the time frame examined below, 2018 was the worst year yet for hashprice, followed by last year’s bear market. The best year came during 2017’s unprecedented bull market, followed by 2020 – which may strike some readers as surprising given the fact that this is the same year when Bitcoin’s third halving cut the block subsidy from 12.5 to 6.25 BTC per block.
Transaction Fees Stay Relatively High but Begin to Fall
In Q3-2023, transaction fees constituted 2.7% of all block rewards, which is down significantly from Q2’s 8.17% figure but still higher than Q1’s 2.3% figure.
Despite the reduction from Q2’s transaction fee revenues, miners were still raking it in during Q3 when compared to last year’s figures. In Q3-2022, transaction fees only accounted for 1.7% of all block rewards, and the 2022 average was even less at 1.64%. So far in 2023, transaction fees have been 4.38% of block rewards.
As we discussed in our Q2-2023 report, 2023’s transaction fee increase stems from a paradigm shift in blockspace market dynamics from inscriptions / ordinals, a new standard for creating non-fungible tokens (NFTs) on Bitcoin.
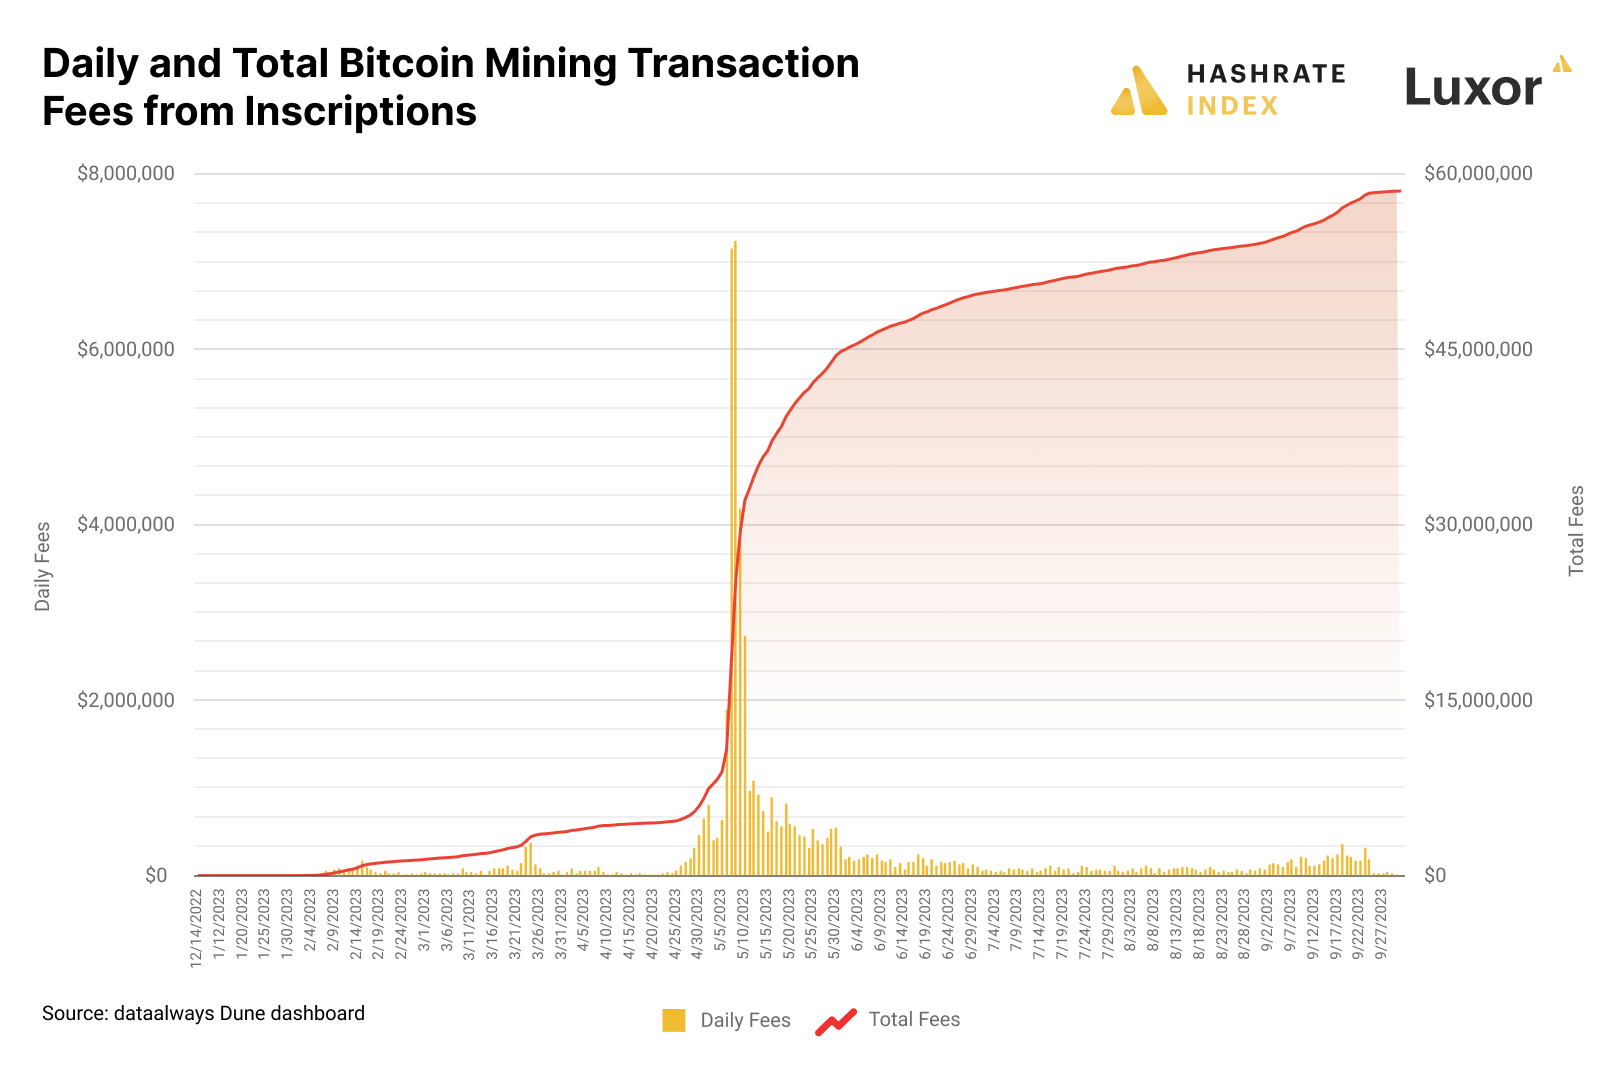
As the chart below illustrates, the supermajority of these transaction fees came during a short spurt in May. In fact, the month of May alone netted miners 1390.89 BTC ($38,156,799), a staggering 66% of all-time inscription fees (as of Q3-2023’s close). This revenue came from a sprint from collector and inscribers for BRC-20 tokens, a subset of inscriptions that use Bitcoin’s OP_CODE function to create text-based series of inscriptions.
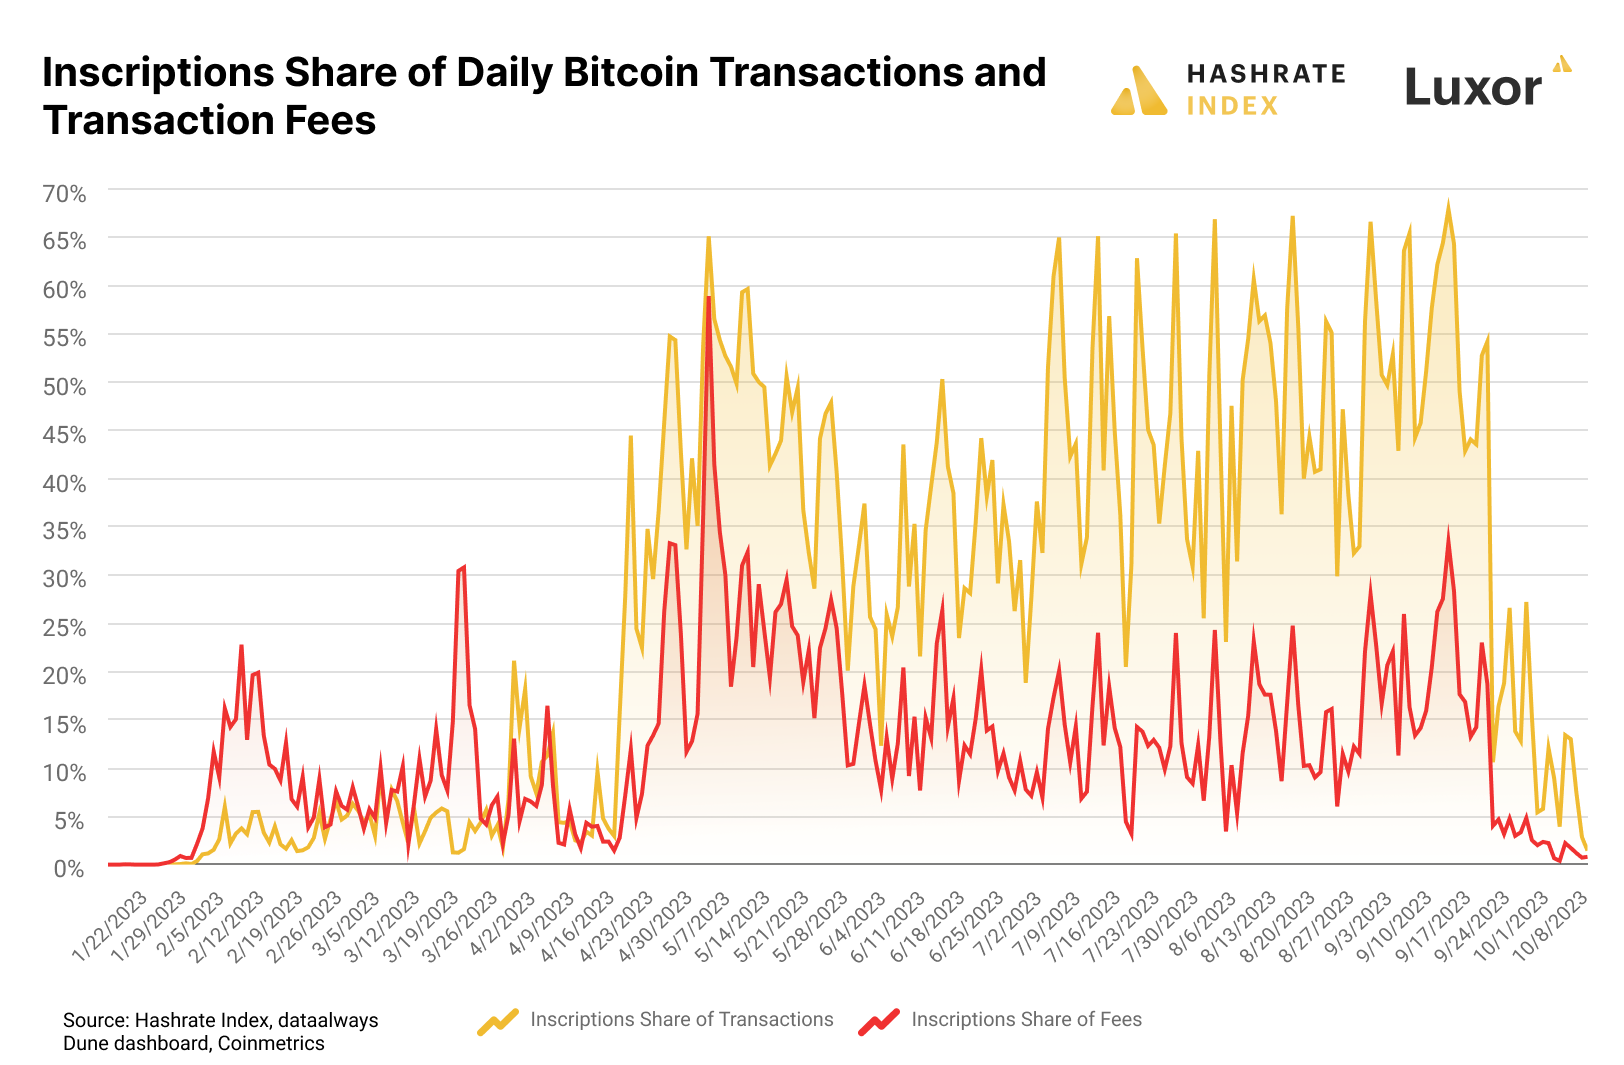
The chart below reinforces that inscription volume is dropping significantly. So far in October, inscriptions have seen their lowest share of both transaction fees and transaction volumes since Q1. In Q3-2023 on average, inscriptions consisted of 45% of daily transactions and 14% of all daily transaction fees; respectively, these averages were 32% and 16% in Q2 and 3% and 8% in Q1.
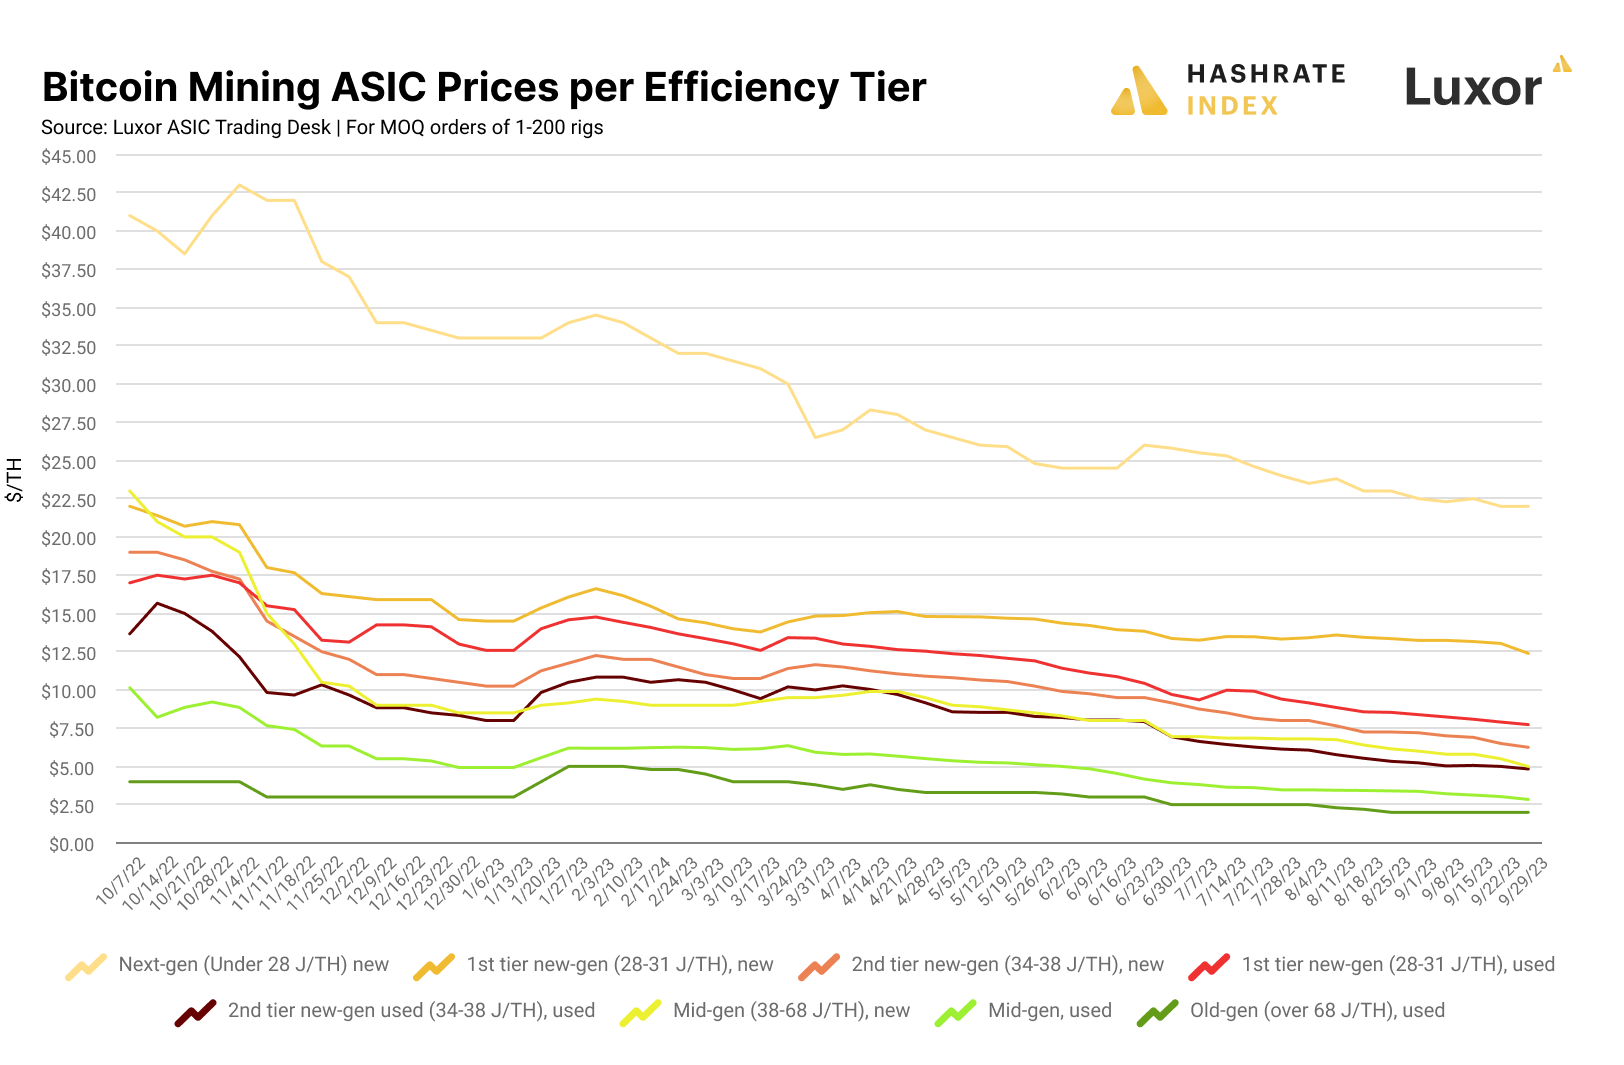
ASIC Prices Hit Lows Again and Again
Bitcoin mining ASICs continue to slide in 2023, with models of all calibers hitting all-time lows in Q3 as mining margins continue to thin.
As the chart below illustrates, what we classify as 1st tier new-gen ASICs (rigs with an efficiency of 28-31 J/TH) have gradually separated from the pack over the year; their premiums began gradually increasing over older and used models in April and the spread has increased ever since. Rigs of all tiers saw a brief bump in prices at the beginning of 2023 as hashprice rallied, and they saw another brief price bump in Q2 in response to improved hashprice economics still from inscription-fueled transaction fee revenue.
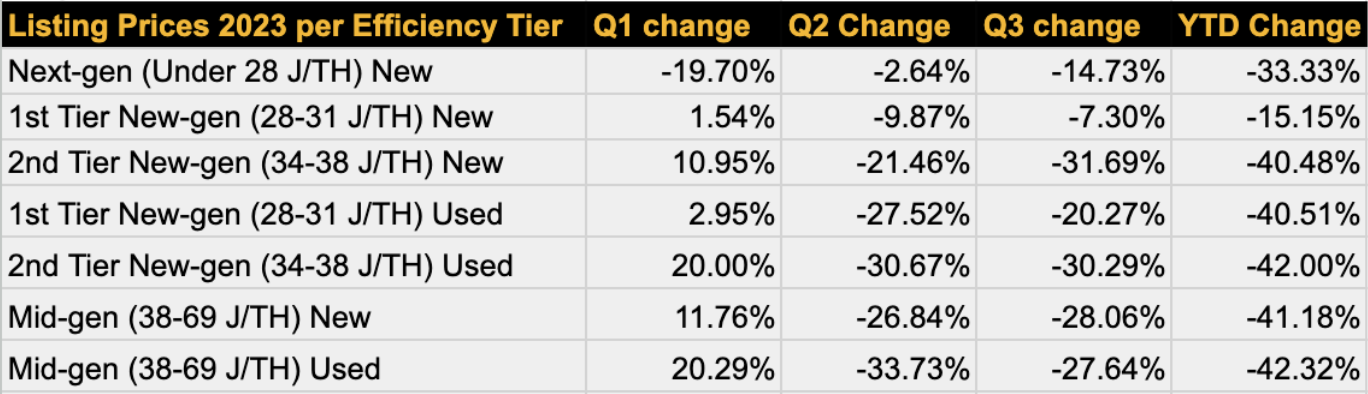
When we look at the change in listing prices for different ASIC efficiency tiers throughout 2023, Q1 stands out as an outlier. Thanks to the rebound in hashprice, every rig tier (except for the next-generations bucket) gained value over the first quarter; inversely, next-gen rigs like the S19 XP were somewhat oversold in Q1 as the recovery in hashprice made less efficient rigs more attractive.
Q2 and Q3 were a different story as selling accelerated, especially for older and less efficient models. The table below drives home the point that miners are beginning to distinguish between 1st tier (28-31 J/TH) and 2nd tier (34-38 J/TH) new-gen ASICs.
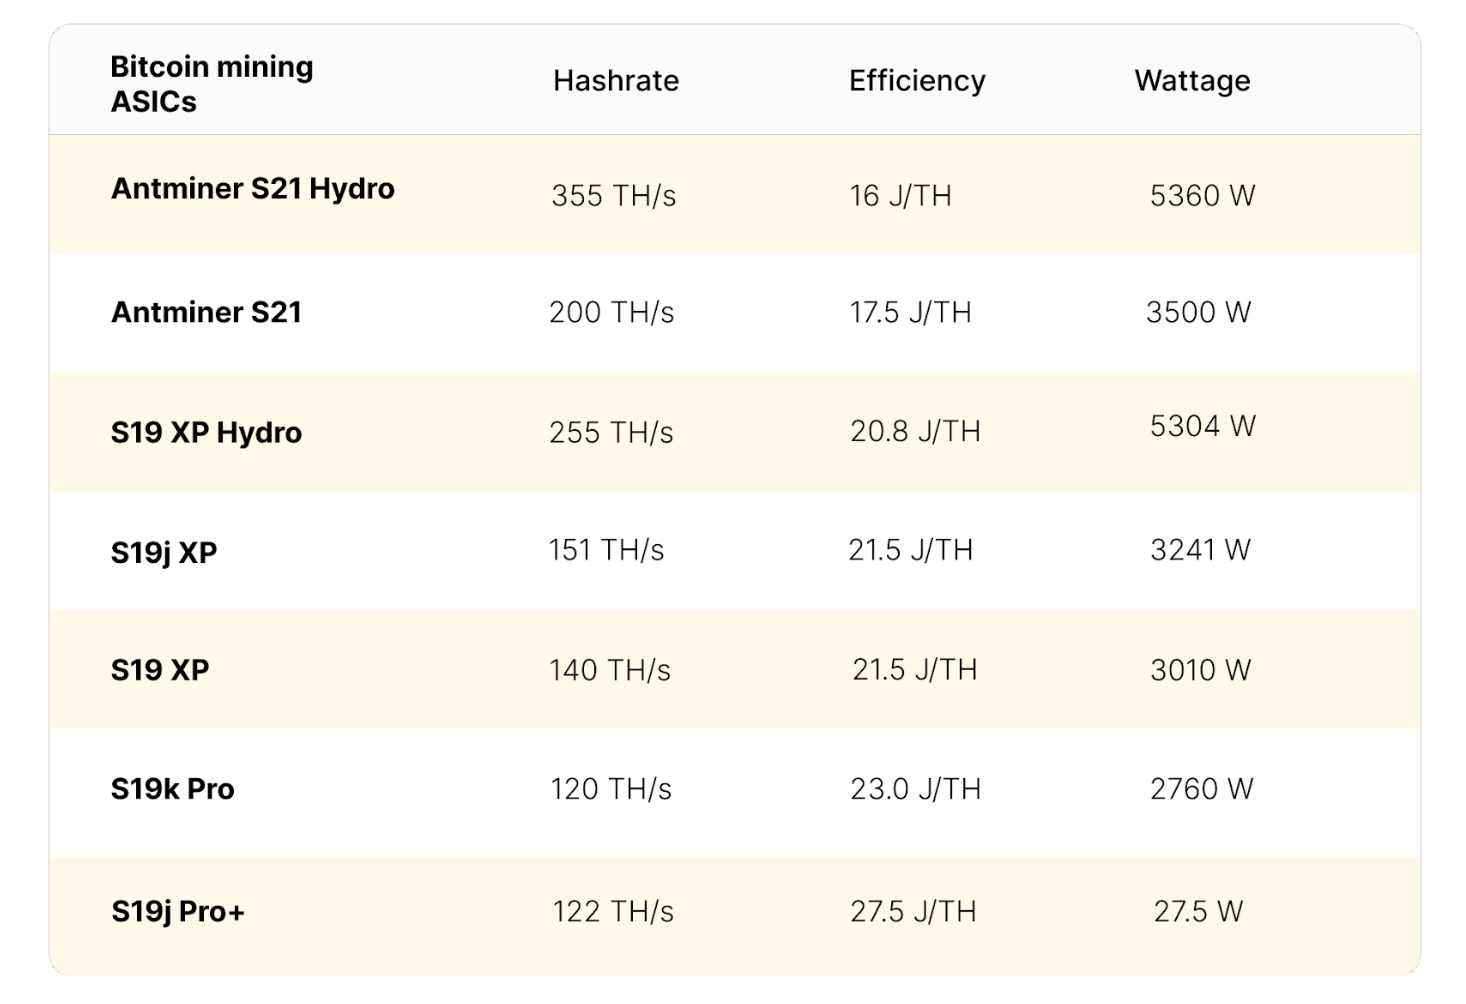
Enter the Antminer S21
Bitmain unveiled its latest ASIC model in September at its World Digital Mining Summit: the Antminer S21, which will come in an air-cooled and hydro-cooled version. The new model is the first-ever Bitcoin mining ASIC to achieve an efficiency under 20 J/TH.
Bitmain could begin shipping units of the S21 as early as December, although a January shipping date is more plausible. The company has plans to manufacture at least 50,000 units per month for 18 months, split 50/50 between air-cooled and hydro models, but they could manufacture as many as 100,000 per month if there is enough demand, a Bitmain rep told Hashrate Index.
At its World Digital Mining Summit, Bitmain announced attractive promotional pricing for bulk pre-orders of S21. For the first phase of preorders, which requires a minimum buy of 1.2 EH/s (6,000 for air-cooled models or 3,380 hydro models) Bitmain is selling the rigs for $14/TH. This comes out to $2,800 per unit for air cooled models and $4,690 per unit for hydro models. The second phase of orders will cost $19.6/TH (per unit, $3,920 for air cooled and $6,566 for hydro cooled) and requires the same 1.2 EH/s minimum order size.
It's important to note that this is promotional pricing for the launch of the Antminer S21 and that later orders will cost more than the promotional pricing. Further, secondary seller pricing has been close to this promotional pricing, with many vendors selling models in the $14-15/TH range.
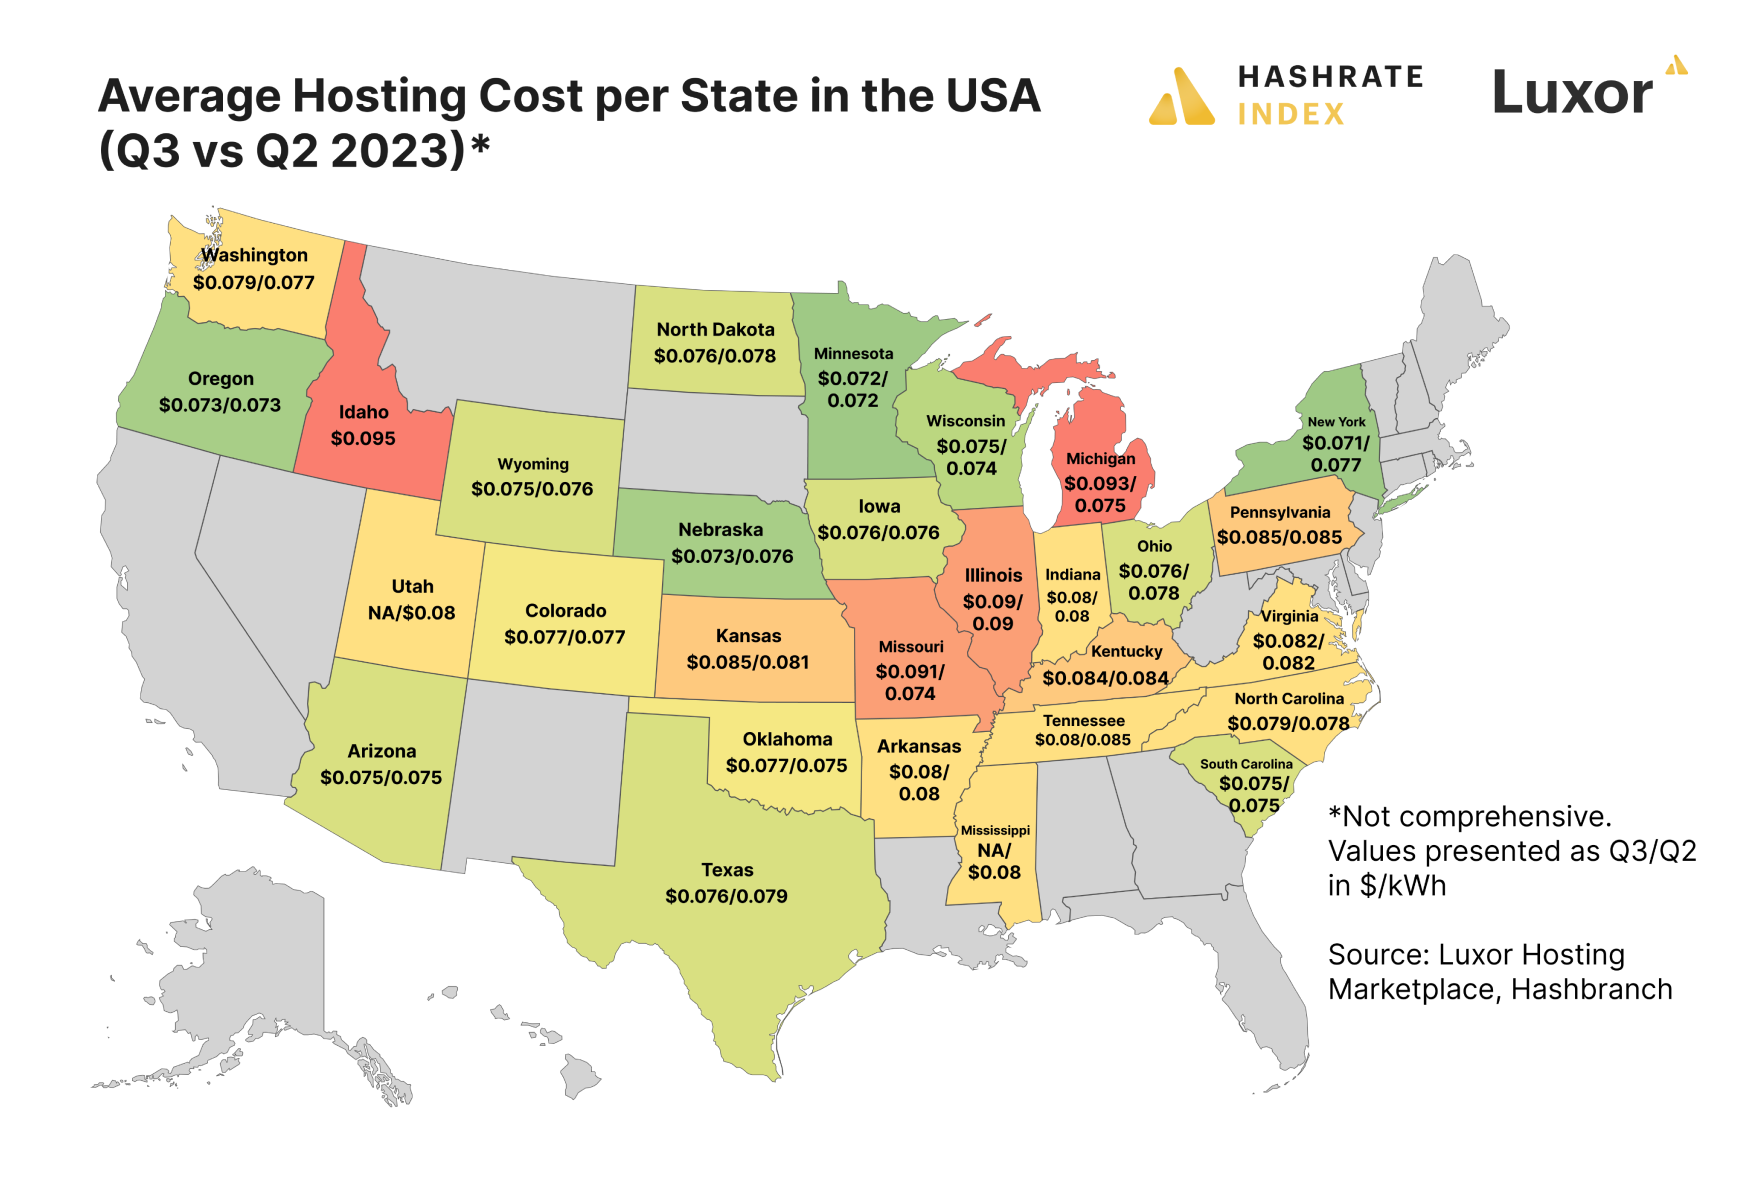
Electricity Prices in the United States Stabilize
This time last year, many miners operating in the United States struggled in a horrible market environment characterized by depressed hashprice and severe electricity price inflation. The US’s average all-in industrial electricity price peaked at an unprecedented $94 per MWh in Q3-2022, which contributed to the bankruptcy of some of the largest players in the space (namely, Compute North and Core Scientific).
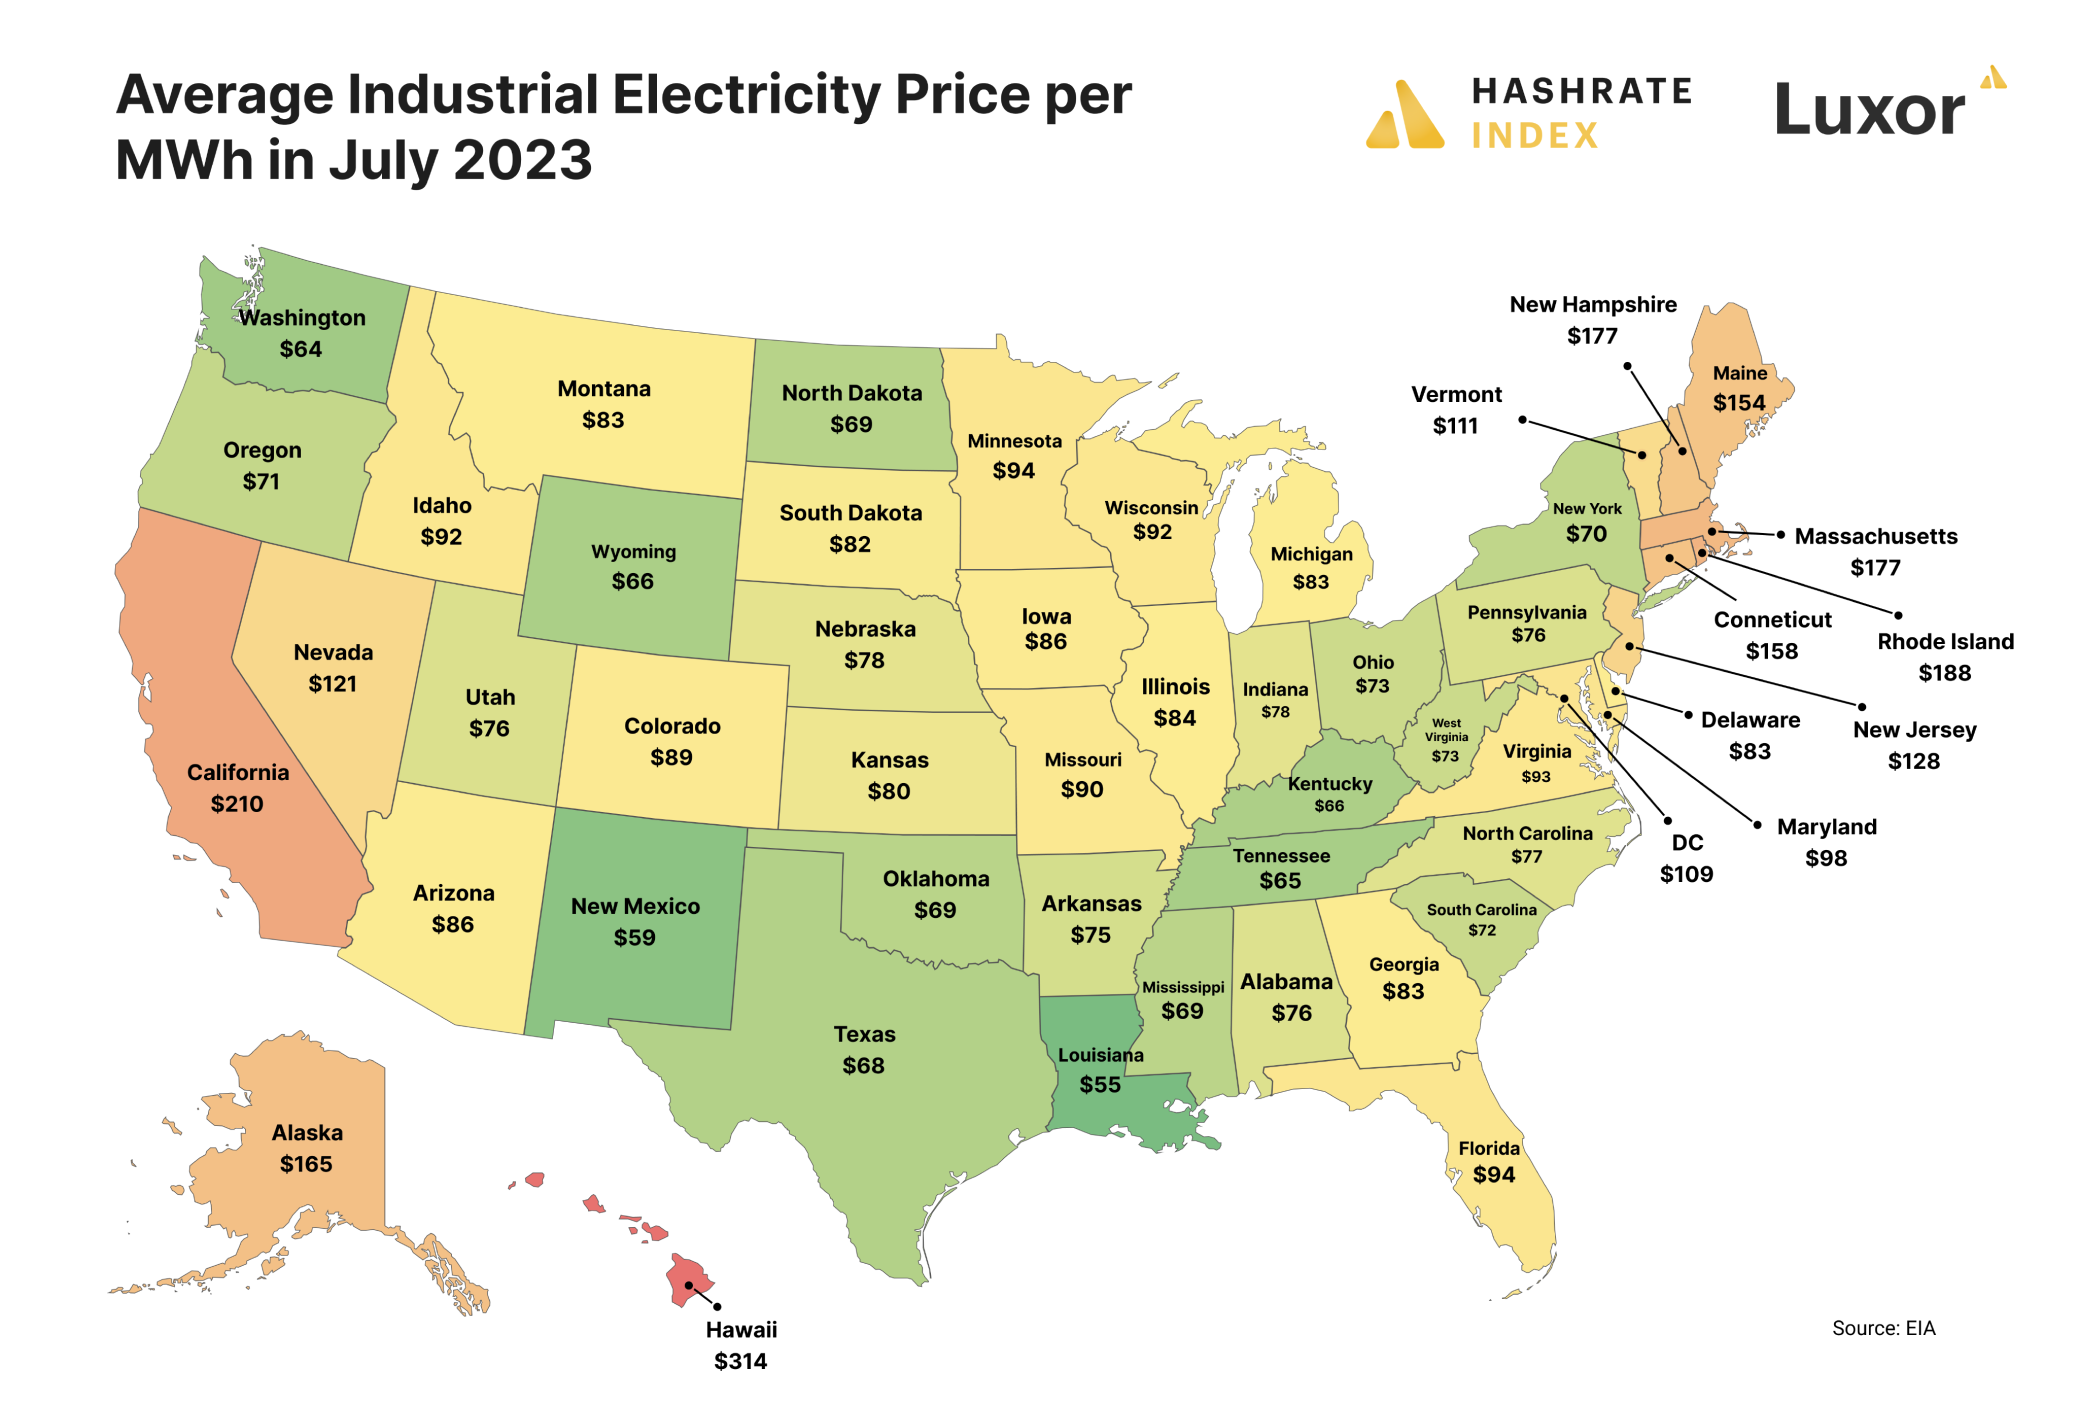
Fast forward to October 2023 and electricity prices have normalized. As the map above displays, prices in mining hubs like Texas, the Southeast, New York state, and the Rust Belt (namely Ohio and Pennsylvania) have reverted to manageable levels, although there are a few outliers (Georgia, for example, is a popular mining state which had high power costs this July 2023).
The average all-in industrial electricity price in Q3-2023 was $86 per megawatt hour (MWh), an 8.5% decline from the same quarter last year. Electricity prices in the United States typically peak in the third quarter as demand for air-conditioning and other cooling is at the highest during the summer.
Bitcoin’s Hashrate Continues Showing New Seasonality Patterns
Anyone paying attention to the Bitcoin mining industry has likely noticed a remarkable pattern that has repeated itself for the last three years. Bitcoin’s hashrate tends to grow in an almost uncontrollable fashion from October through May, but this growth tends to slow down or even retract during the summer months. We particularly saw this pattern in Q3 this year. These seasonal patterns are most plausibly attributed to US-based miners curtailing heavily in the summer months.
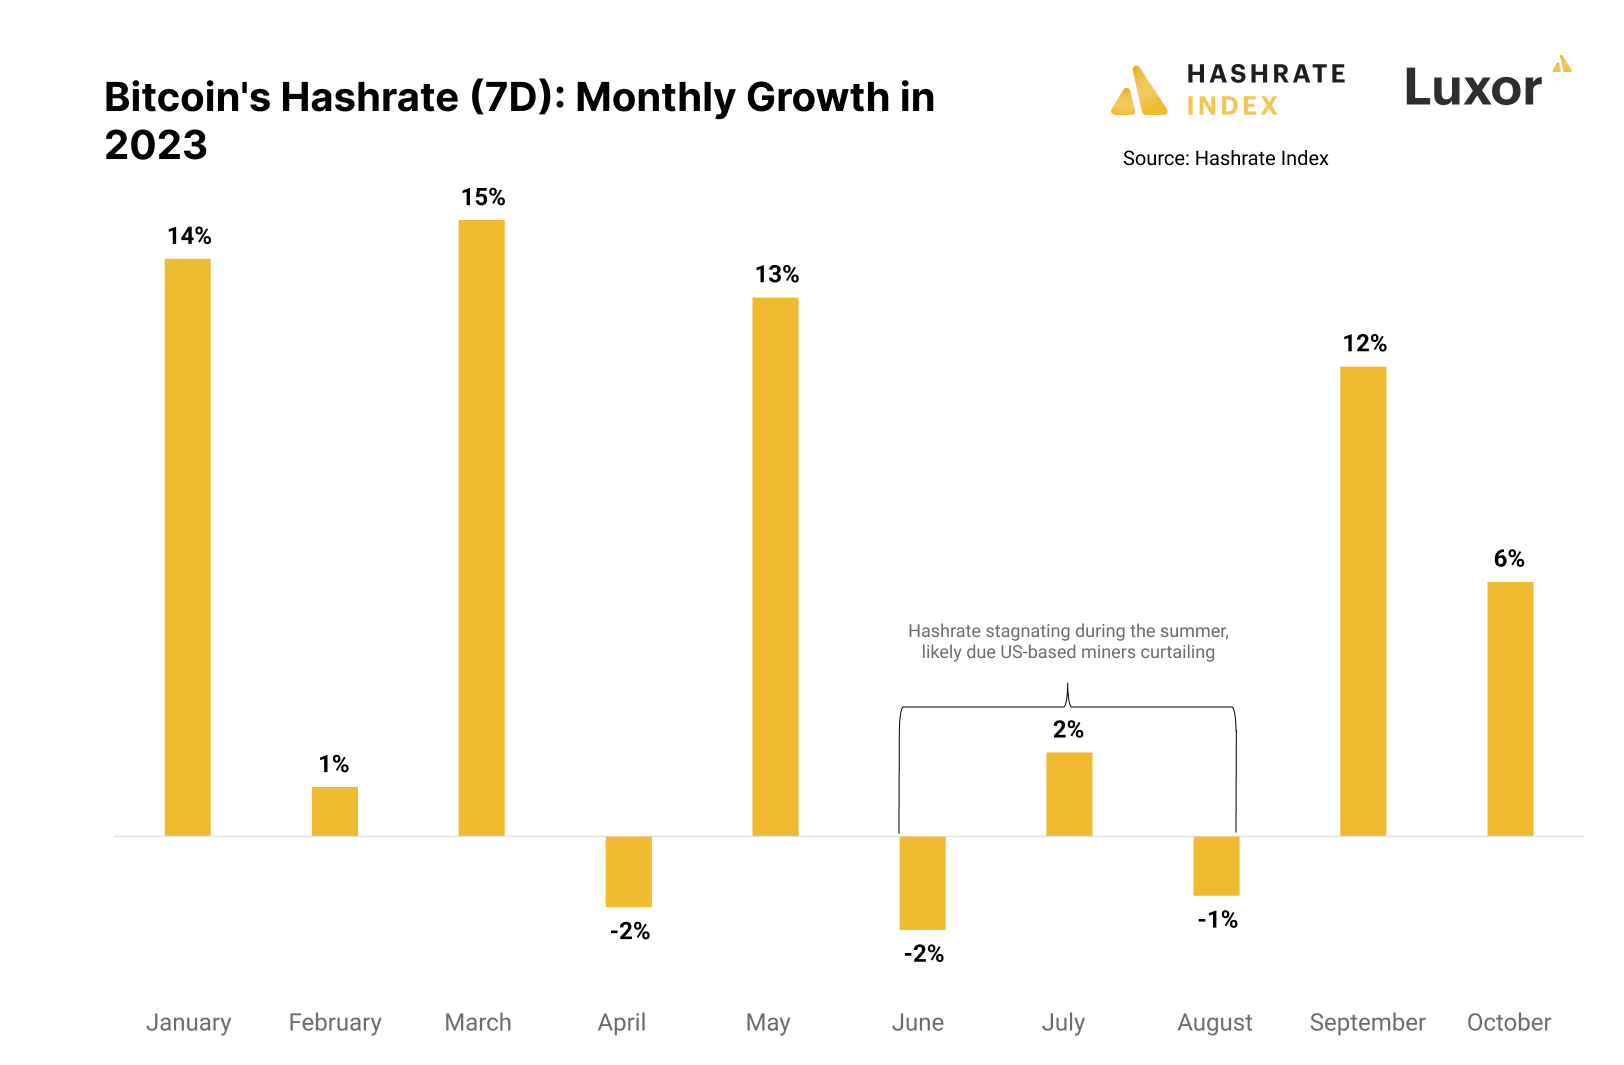
This year, Bitcoin’s 7-day average hashrate grew by 56% during the first five months of the year. Then, for the three summer months of June, July, and August, Bitcoin’s hashrate fell by 1.3%. In September, it suddenly increased by 12%, ultimately reaching an all-time high in mid-October after growing 6% so far this month.
We are relatively certain that this seasonal pattern is caused by US-based miners curtailing during the summer months, particularly in Texas.
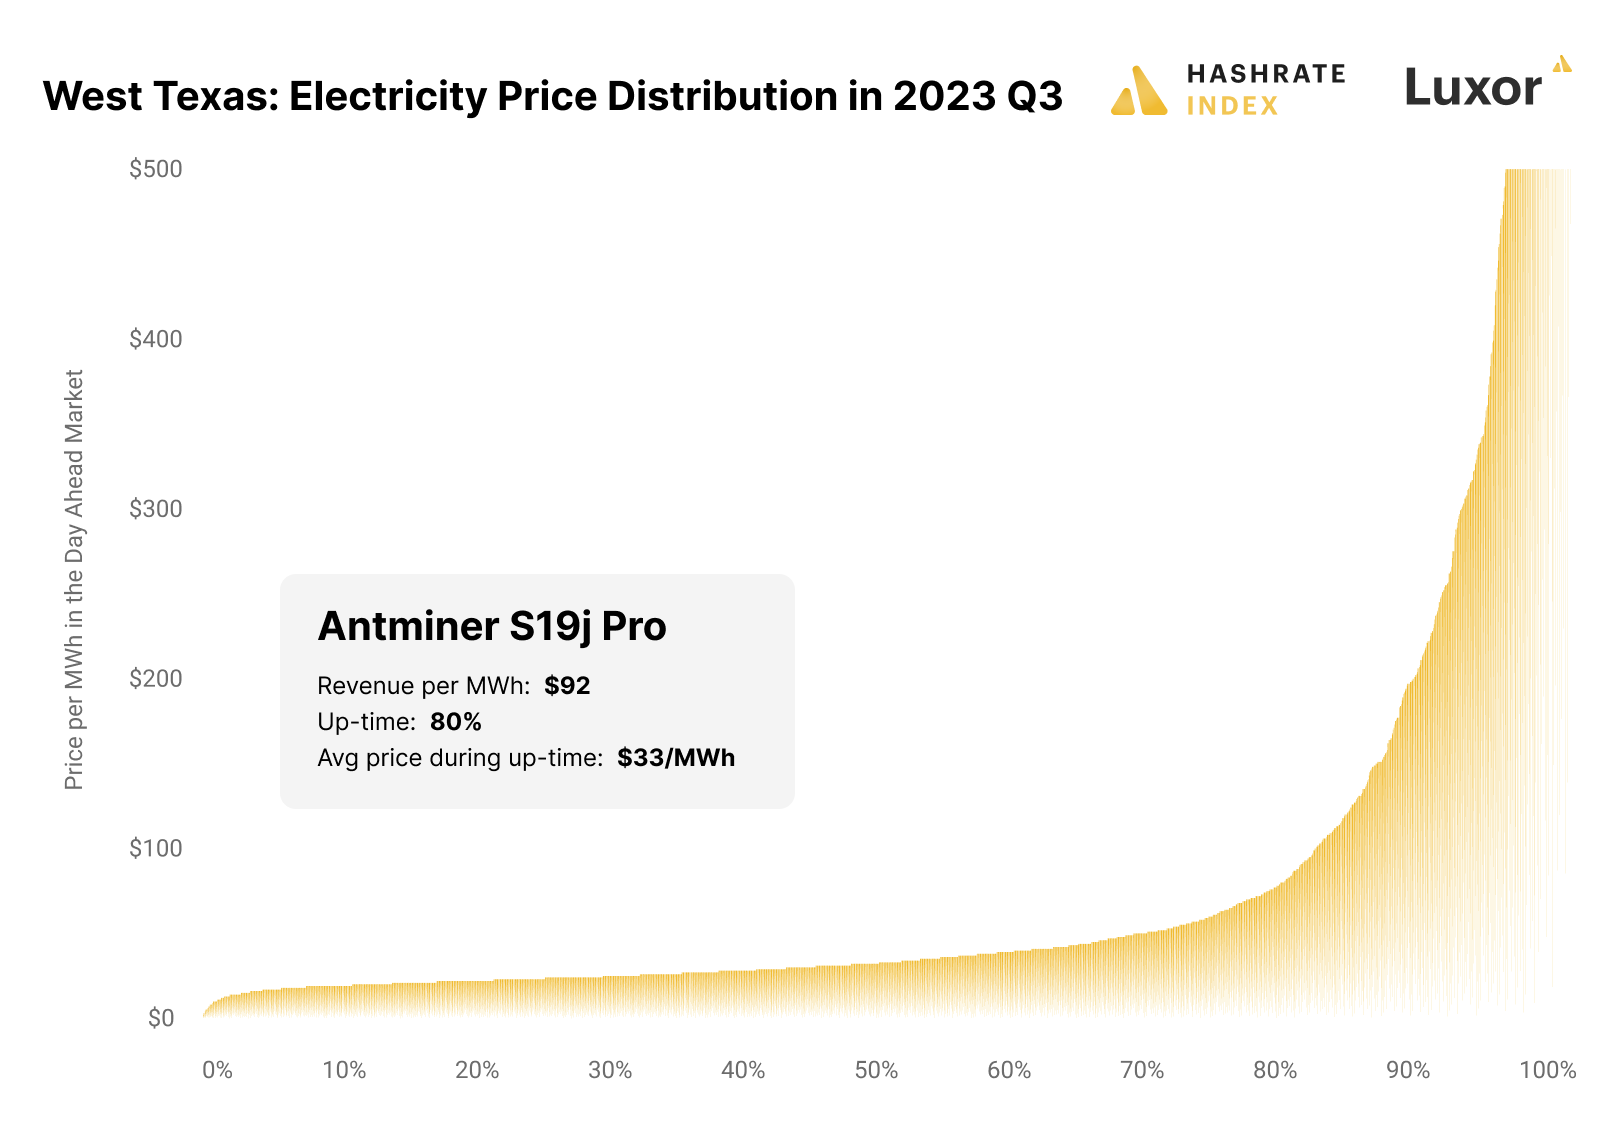
The chart below shows the power price distribution in West Texas in Q3-2023. As you can see, there were a relatively high number of hours that were priced higher than Q3’s average revenue per MWh for the S19j Pro of $92. Texas-based miners normally curtail during these hours. Given this data, a West Texas-based miner running a fleet of S19j Pros would conceivably have an up-time of 80%, and it would curtail the other 20% of the time when power prices surpassed the revenue per MWh of its S19j Pro fleet. The miner would have an average power price during its up-time of $33 per MWh.
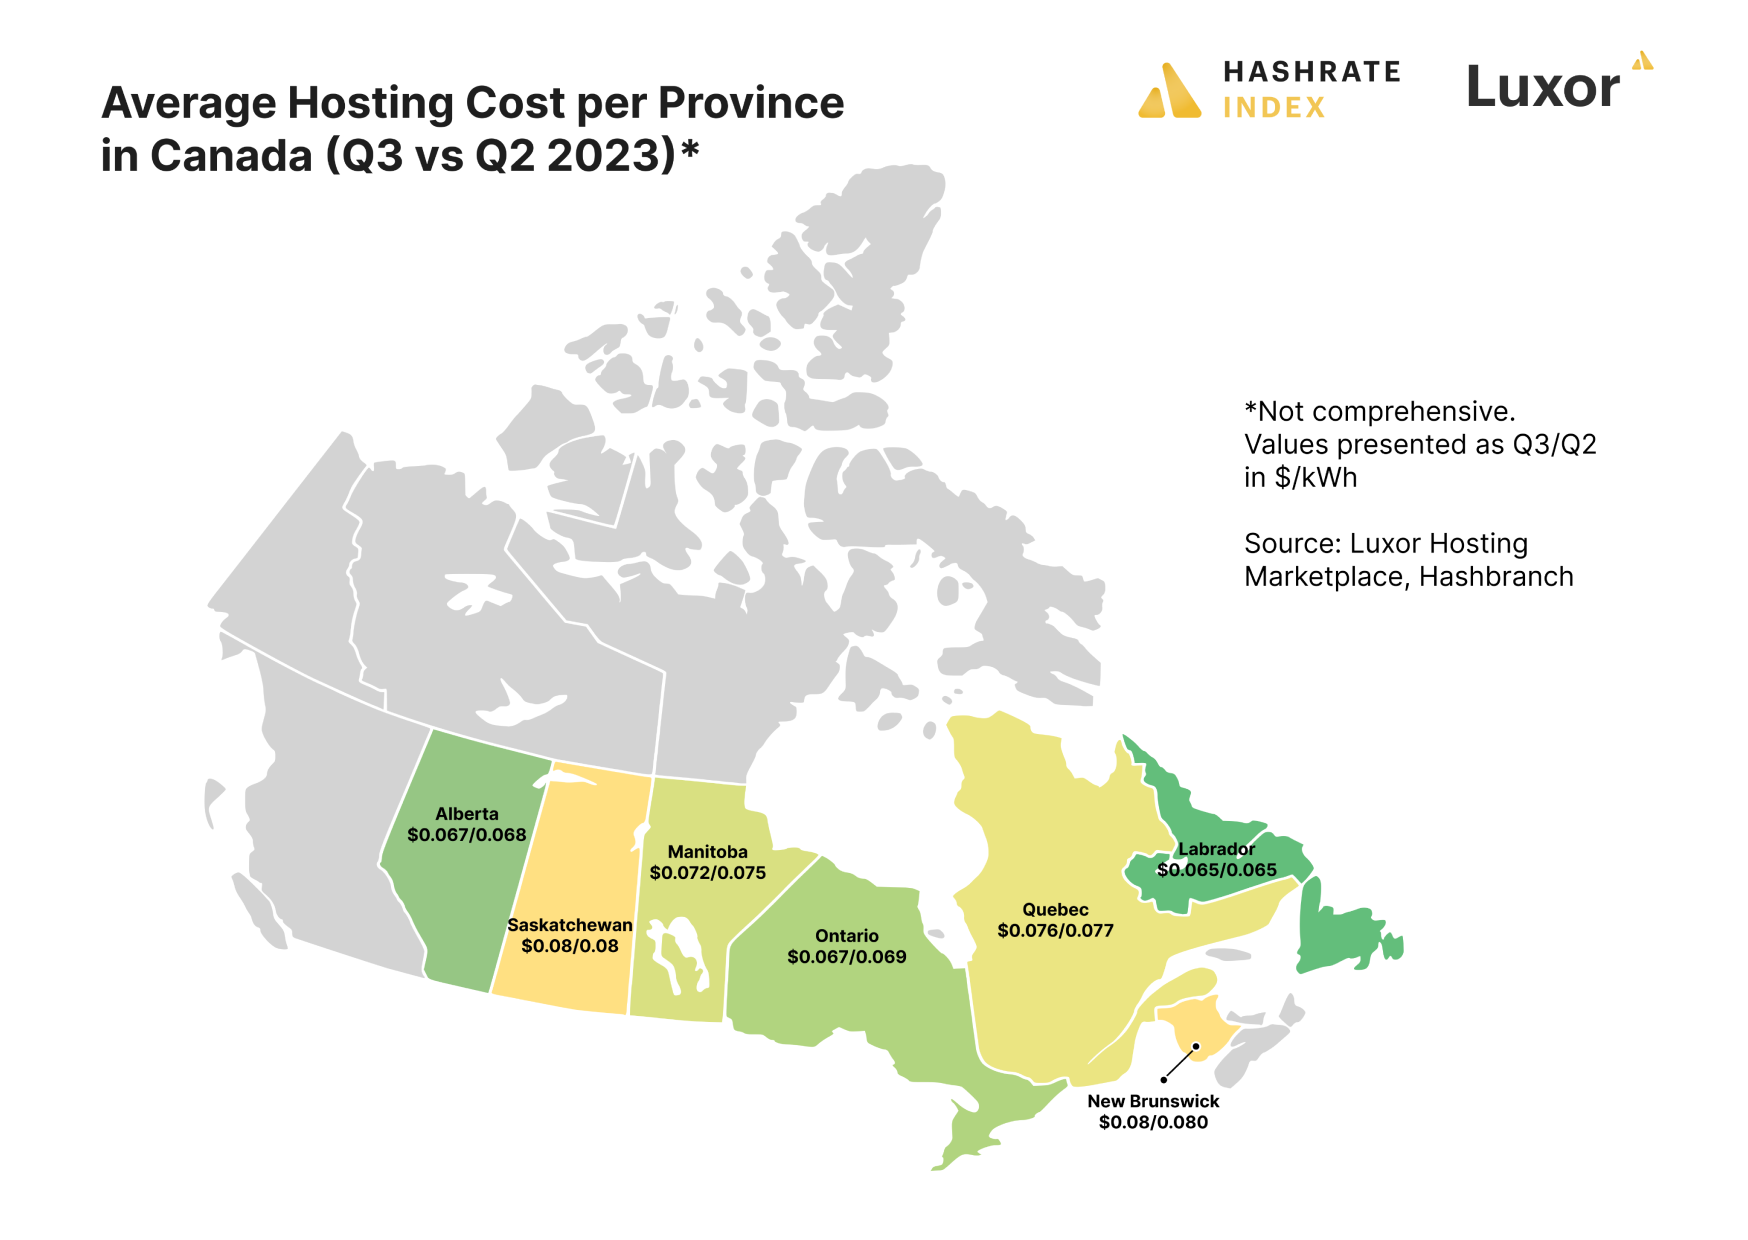
Hosting Rates in the US and Canada Remain Relatively Stable
Hosting rates in the United States and Canada did not change by any meaningful degree between Q2-2023 and Q3-2023.
Per our index, which pulls numbers from Luxor business data and Hashbranch, the national average in the United States (for all hosting sizes) was $0.0790/kWh in Q3-2023, versus $0.0787/kWh in Q2-2023; the average in Canada was $0.0725/KWh for Q3-2023, versus $0.0722/kWh in Q2-2023 (all prices are in USD).
In the United States, the average discount for hosting a large fleet (more than 200 ASICs) versus a small fleet (1-99 ASICs) was 8% in Q3-2023, compared to 7.5% in Q2-2023; the discount for a large hosting agreement versus a medium one (100-200 ASICs) was 6.6% in Q3-2023, compared to 5.3% in Q2-2023.
Bitcoin Mining Stocks Rally then Retrace in Q3
Bitcoin mining stocks started out Q3-2023 strong. Piggybacking on Bitcoin’s rally to $30,000, they surged in July, only to slump throughout the rest of the quarter and erase all of the gains they experienced in the first month of Q3.
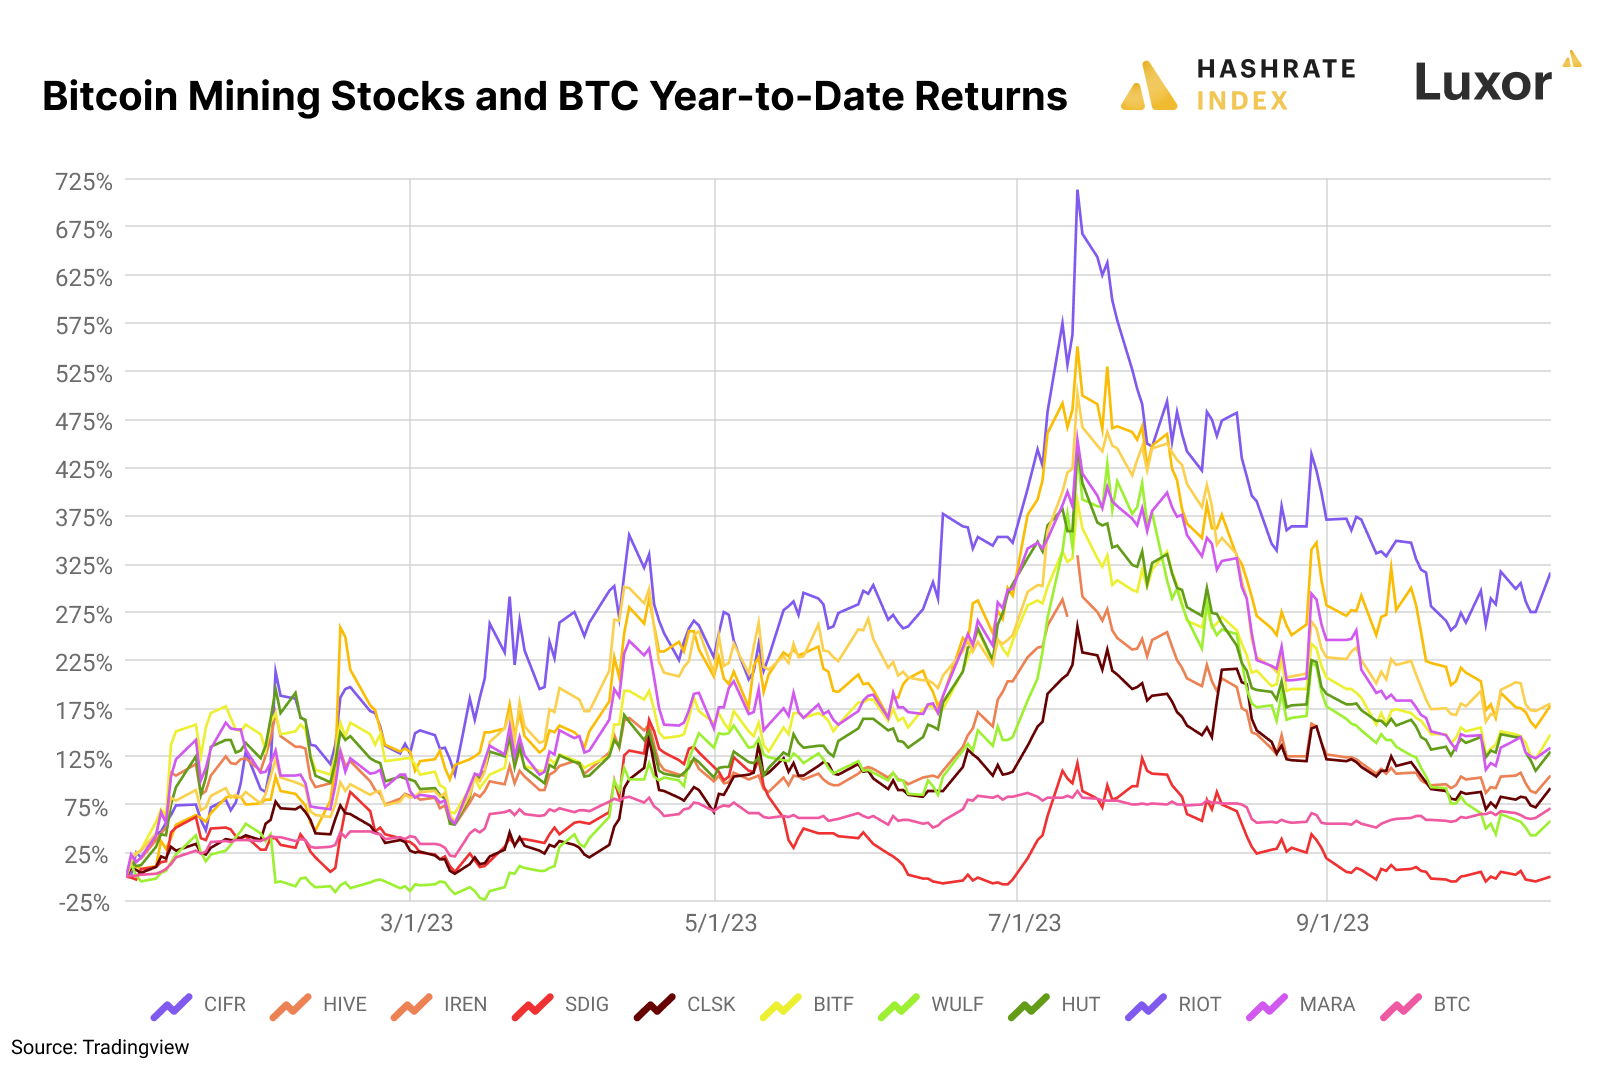
The price action is a good reminder that, generally speaking, Bitcoin mining stocks are still acting as high-beta trades in relation to Bitcoin’s price. Rather than evaluating Bitcoin mining stocks based on fundamentals like fleet efficiency, power price / power trading strategies, and operational execution, the market typically values them based on Bitcoin’s own price movements. When number go up, Bitcoin mining stock prices go up higher, faster, and vice versa when number go down.
These are just a few of the insights we cover in our Q3 report, so please download the report above, share it with your friends/colleagues, and enjoy!


Hashrate Index Newsletter
Join the newsletter to receive the latest updates in your inbox.


